2017 brought us the ninth season of “Curb Your Enthusiasm” (six whole years after season eight). I wanted to do a quick network analysis of the new season to check what we can learn from such a formalisation. To those of you who have watched it, this list of all ten episodes might serve as a quick recap, as “Curb” episode titles are usually good summaries, too:
- 9x01: Foisted!
- 9x02: The Pickle Gambit
- 9x03: A Disturbance in the Kitchen
- 9x04: Running with the Bulls
- 9x05: Thank You for Your Service
- 9x06: The Accidental Text on Purpose
- 9x07: Namaste
- 9x08: Never Wait for Seconds!
- 9x09: The Shucker
- 9x10: Fatwa!
Extraction Method and Visualisation
To link two characters to each other I used the same approach as in our research on social networks in dramatic texts: “Two characters interact with one another if they perform a speech act within the same segment of a drama (usually a ‘scene’).” (quoted from these slides; just replace ‘drama’ by ‘TV series’)
I segmented all 10 episodes by hand (414 segments across all ten episodes) and put them in the very simple format that our own tool ezlinavis parses to calculate network relations. And here’s the result after Gephi’ing it up a bit (licensed under CC BY 4.0):
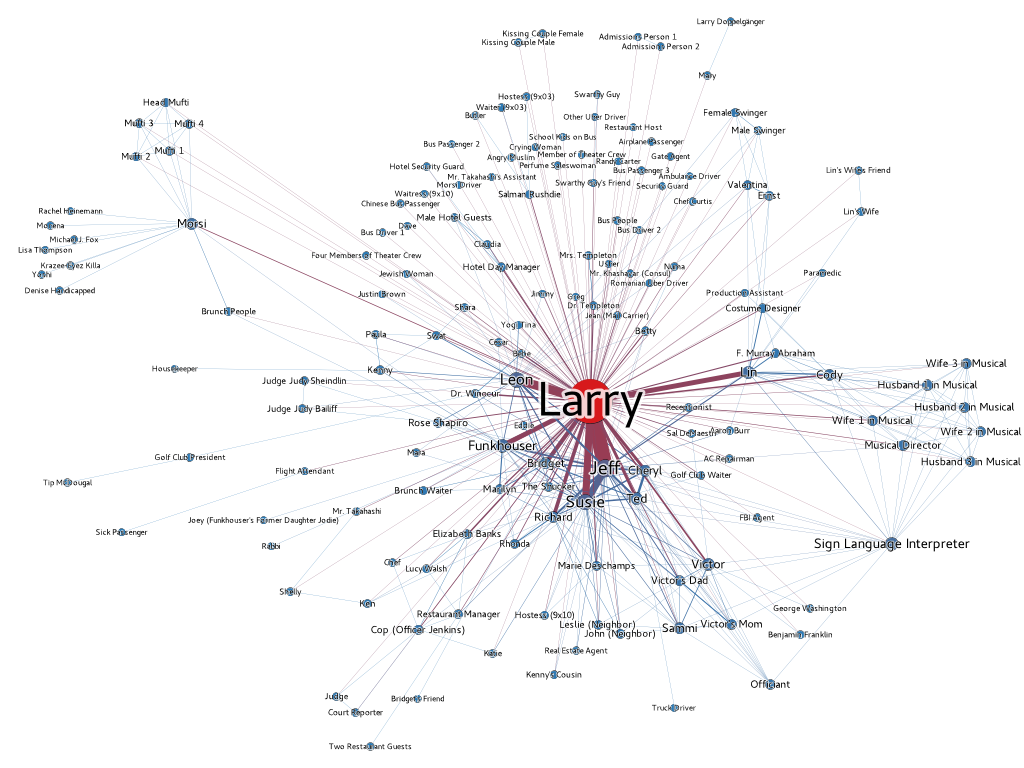
No surprise there, “Curb” by all means is a Larry-centric show. There is hardly any scene without him, and each character of the show is only defined by his or her relation to Larry. We don’t know what Richard Lewis is doing or what Jeff and Susie are talking about when Larry’s not around. A notable exception in the above graph can be spotted in the left upper corner, Morsi’s visits to characters of older seasons of the show in episode 9x08.
While the Larry-centricity should be no news to watchers of the show, it is another thing to see this visualised for clarity.
Some Network-Related Rankings
Let’s look at some network-analytical metrics to get some more insights. The whole graph has 152 nodes and 427 edges. Most of the nodes are individual characters (with proper or generic names), some of them are groups of people (like the Male Hotel Guests trying to open a pickle jar in episode 9x02 or the Bus People in episode 9x07).
The network density is 0.037, a very low value, which has to do with the fact that the show is not interested in establishing relations between all its characters. Like mentioned above, all characters only come to life in their relation to Larry. The average path length is 2.197, not really a very meaningful value either for this network graph. It just means that, hypothetically, every character can reach any other character of the network via Larry, in no more than two steps, with a few exceptions.
More interesting are some node-related metrics, let’s have a look at the 10 characters with the highest degree:
| Character | Degree |
|---|---|
| Larry | 132 |
| Jeff | 36 |
| Susie | 29 |
| Leon | 27 |
| Funkhouser | 20 |
| Lin | 19 |
| Sign Language Interpreter | 19 |
| Victor | 17 |
| Ted | 16 |
| Cheryl | 15 |
So out of 151 possible connections to other characters in the network, Larry directly relates to 132 of them. A bit surprising is the high-ranking position of the Sign Language Interpreter who only appears in the last episode 9x10 (spot her in the bottom right corner of the network visualisation). Her appearance was a bit difficult to formalise. Her interpretation for the deaf is recognised by many of the main characters, which is why I established a link in each of these cases. Her degree value is high up also because she is present at two different events with two different audiences, the rehearsal for the musical and Sammi’s wedding.
But there’s a way to rank characters by their actual presence throughout the whole season. Let’s check their weighted degree (or, ‘strength’). The top ten looks a tad different here:
| Character | Weighted Degree |
|---|---|
| Larry | 573 |
| Jeff | 234 |
| Susie | 153 |
| Leon | 115 |
| Funkhouser | 73 |
| Ted | 69 |
| Cheryl | 68 |
| Lin | 67 |
| Bridget | 66 |
| Richard | 53 |
The Sign Language Interpreter as well as Sammi’s husband-to-be Victor fall out of this ranking, while Bridget (Larry’s girlfriend during some of the episodes) and his old pal Richard Lewis enter the picture. Ted and Cheryl, who are now an item, also rank higher, showing that they actually did occur on different occasions during the season, also if they didn’t play a central part.
Mrs. Templeton and Other Intricacies
Segmenting the episodes and identifying and placing all characters can be challenging. In general, I tried to use the cast lists on IMDb to find the right names for all characters, especially if they aren’t given actual names (but are listed under generic terms like “Hotel Day Manager” or “Receptionist”). If known characters appear under different names (Larry as “Buck Dancer” and Leon as “Chappie Johnson” in episode 9x02), I ignored that. In some few cases I had to introduce group names like “Male Hotel Guests”, because the characters didn’t act as distinguishable individuals but as part of a group.
And then there’s Mrs. Templeton, wife of Larry’s therapist Dr. Templeton in episode 9x04. We never see her talking at all, but I interpreted her wordless snubbing of Larry as speech act, which is why she appears in the graph. All in all, I tried to be as objective as possible. Feel free to have a look at the segmentation files.
Data and Software Used
Speaking of which, I opened a repo on GitHub for this small project, see here, where you can find the formalisation for each episode. After formalising, I threw the files into ezlinavis and saved the resulting network data in an CSV file, which I then opened in Gephi to calculate and visualise everything you’ve seen above.
As for “Curb”, word has it that we won’t have to wait another six years for the next season, production for season ten is said to start next spring.