Last level. Final boss. Arguably the longest play ever written: “The Last Days of Mankind”, brought to light between 1915 and 1922 by your favourite Austrian crank: writer and journalist Karl Kraus (1874–1936).
More than 600 pages in the German original, five acts, prologue and epilogue, 220 scenes altogether documenting the apocalypse of World War I. A first complete translation to English was published at Yale University Press in 2015 (done by Fred Bridgham and Edward Timms).
As Kraus notes in the preface:
“The performance of this drama, which would take some 10 evenings in terrestrial time, is intended for a theatre on Mars. Theatre-goers on planet earth would find it unendurable.”
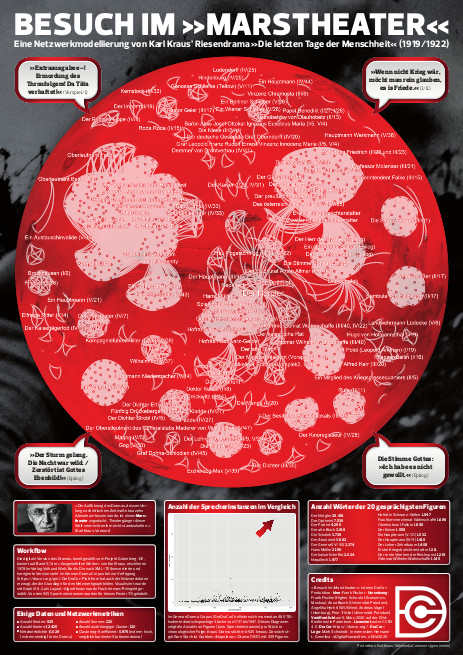
Now what did we do? Dialogues in the play are distributed among a total of 925 speaking instances (individual characters, voices, groups, choirs). We extracted the social network graph (based on co-occurrences of characters per scene) from the TEI version of the play. And then we took Kraus at his word and projected the network graph onto planet Mars. Resulting in our poster contribution for DHd2020 held in Paderborn in early March (one of the last conferences before coronavirus lockdown):
Our visit to the Mars theatre won us the Best Poster Award, which we were very happy about. Feel free to download the hi-res version from Figshare (beware, it’s heavy). There’s also a lenghty Twitter thread about our work (in German).
Some properties of the network:
- Number of nodes: 925
- Number of edges: 12.425
- Network density: 0,029 (very low in comparison to other plays)
- Number of independent clusters: 120
- Clustering coefficient: 0,976 (extremely high, corresponds to the value of other station dramas)
If you want to toy around with the network data yourself, you can download it in CSV, GEXF and GraphML format from DraCor.