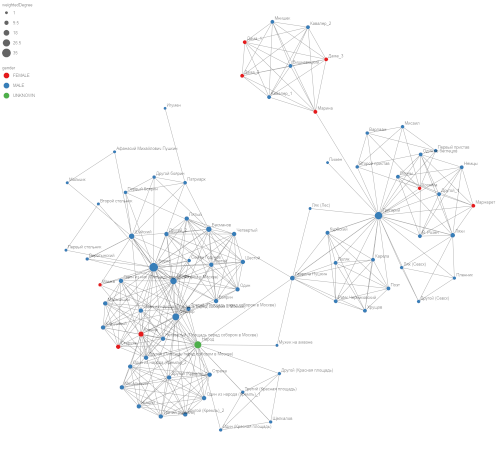
DraCor is the Drama Corpora platform at dracor.org which holds a growing number of collections of plays of different languages, countries and times (German, Russian, Spanish, Swedish, Roman, Greek, with more to come). All plays are encoded in XML-TEI, but you don’t have to meddle with the XML since the DraCor API makes it really easy to access structured information, e.g., network data based on the co-occurrence of characters per scene (as an example, here’s the social network extracted from Shakespeare’s “Hamlet”).
You can do all kinds of things with this network data, e.g., feed them into network visualisation tools. So, a couple of weeks ago, Twitter pointed us to two interesting Python packages, webweb and netwulf:
- webweb is “a tool for creating, displaying, and sharing interactive network visualizations on the web” (DOI:10.21105/joss.01458),
- netwulf is “an interactive visualization tool for networkx Graph-objects, that allows you to produce beautifully looking network visualizations” (netwulf.readthedocs.io).
It’s really easy to get started and we decided to give these two a spin, thereby also demonstrating the versatility of our DraCor API which provides network data for all TEI-encoded plays of any corpus on the fly.
We prepared a Jupyter notebook with the code ready to be executed.
If you want to play with drama networks without doing the legwork, we uploaded some ready-to-use HTML pages generated by webweb:
- Pushkin: Boris Godunov
- Lessing: Emilia Galotti
- Russian Drama Corpus (you can choose between 190 plays in the left upper corner)
- German Drama Corpus (dito, between 474 plays)
But let’s start to toy around with the other library first:
netwulf
We created a universal function (netwulf_representation in our Jupyter Notebook) and a function to retrieve the titles of all plays of a corpus (retrieve_all_plays).
Now let’s take Pushkin’s historical tragedy “Boris Godunov” (c. 1825) as an example:
# 1st network: gender groups without labels (other attributes are default)
netwulf_representation('rus', 'pushkin-boris-godunov', group='gender', show_node_labels=False)
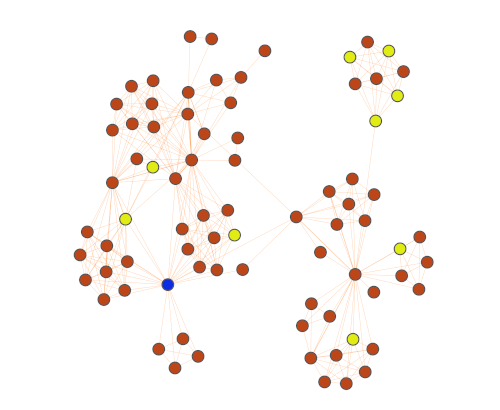
# 2ns network: gender groups with labels
netwulf_representation('rus', 'pushkin-boris-godunov', group='gender')

# 3rd network: isGroup groups with labels
netwulf_representation('rus', 'pushkin-boris-godunov', group='isGroup')
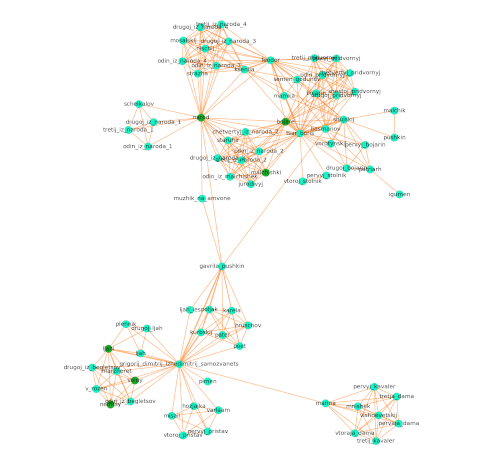
# 4th network: gender groups with numOfSpeechActs size without labels
netwulf_representation('rus', 'pushkin-boris-godunov', group='gender', size='numOfSpeechActs', show_node_labels=False)
By the way, in order to fully regnerate the network (the radii of nodes are not stored by default by netwulf) we need to add a ‘size’ field to the nodes:
for node in network['nodes']:
    node['size'] = node['radius']
Now, as second example, let’s turn to German drama and try the usual suspect, Lessing’s “Emilia Galotti” (1772):
# 1st network: gender groups without labels
netwulf_representation('ger', 'lessing-emilia-galotti', group='gender', show_node_labels=False)  # other attributes are default (see above)
# 2nd network: isGroup groups with labels and degree sizes
netwulf_representation('ger', 'lessing-emilia-galotti', group='isGroup', size='degree')
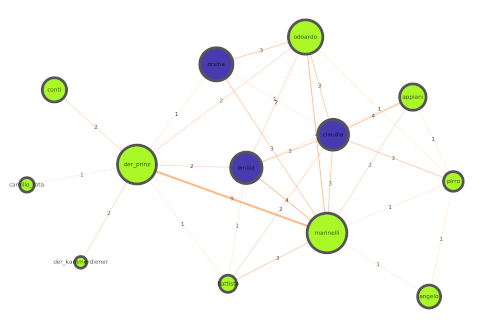
# 3rd network: gender groups with node and link labels and numOfWords size
netwulf_representation('ger', 'lessing-emilia-galotti', group='gender', size='numOfWords', show_link_labels=True)
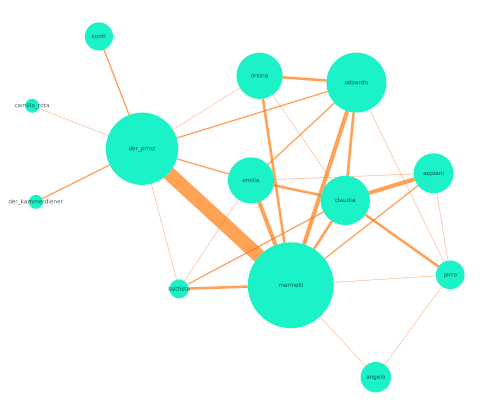
# 4th network: all characters with numOfScenes size with node and link labels
netwulf_representation('ger', 'lessing-emilia-galotti', size='numOfSpeechActs')
It is also possible to apply our script to all plays of a corpus (e.g., the Russian one):
playnames = retrieve_all_plays('rus')
for playname in playnames:
    netwulf_representation('rus', playname, size='weightedDegree', group='gender', show_link_labels=True, is_test=True)
With this piece of code, netwulf will launch the networks one by one. It will display each network for 5 seconds, followed by a 3-second fade-out before opening the next one. So if you are really bored, you can let hundreds of Russian drama networks pass by your eye. Our collection of currently 190 plays will steal 25 minutes of your time.
webweb
Dan Larremore’s webweb library offers a similar approach to visualise network data (see their documentation). We wrote two scripts: the first one is for representing only one play, the second one for representing several plays, for example, a whole corpus, or translations or different editions of the same play.
We created a universal function to integrate DraCor data with webweb (webweb_representation in our our Jupyter Notebook). This script is a bit easier and uses less additional parameters. That is because the library provides us an opportunity to fine-tune the settings such as ‘color nodes by’/’scale node sizes by’ interactively in the generated HTML file. Definitely an advantage since you don’t have to restart the program.
Other advantages as follows:
- interactive captions where you can interactively scale node sizes (although they are limited to 5 sizes),
- ability to highlight a node (but it’s not possible to highlight groups of nodes, only if these nodes have a common letter sequence in their labels), yet in netwulf we can highlight any number of nodes (need to tap twice on each of them),
- choose between a collection of networks (ability to compare them on one page), dynamic networks (ability to see change over time),
- ability to color nodes,
- SVG output.
In our opinion, webweb also has some disadvantages in comparison to the netwulf library:
- inability to zoom in and out,
- no possibility to freely change parameters (e.g., colour sets, node radius, etc.) as with netwulf library,
- some parameters (like the link opacity) are binary while in netwulf they are continuous, some parameters are missing (e.g., stroke width, and no ‘wiggle’ option),
- inability to restore a graph (not in SVG format) in the exact same way.
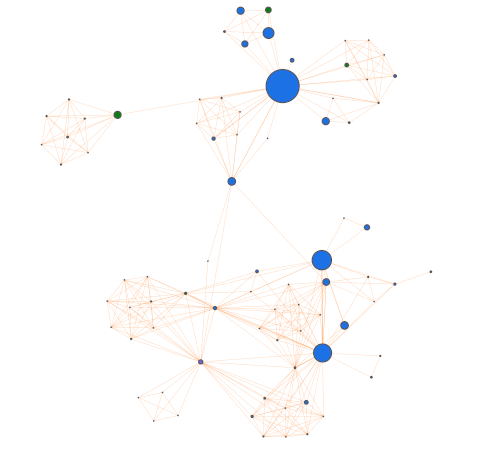
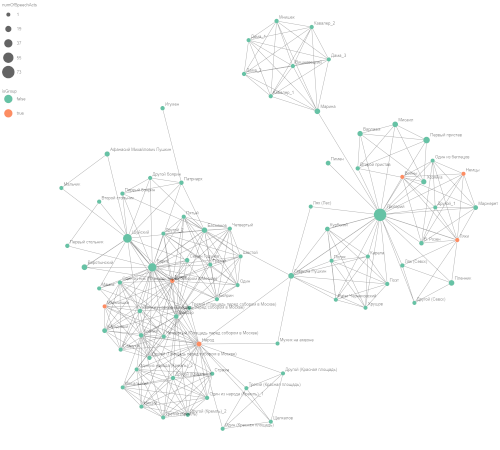
Let’s look at the graphs produced by webweb. First Pushkin’s “Boris Godunov”:
# first network: gender groups with labels (size == weightedDegree)
# second network: isGroup groups with labels (size == numOfSpeechActs)
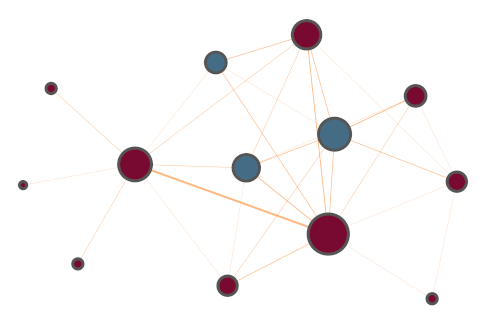
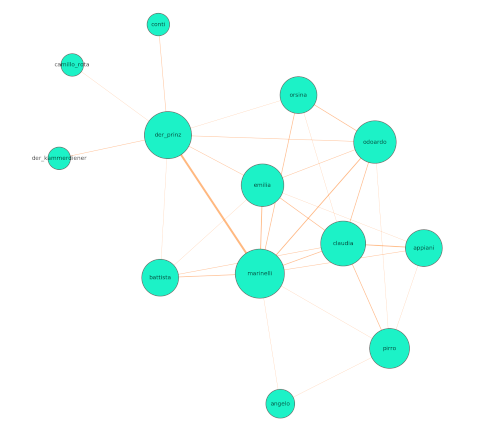
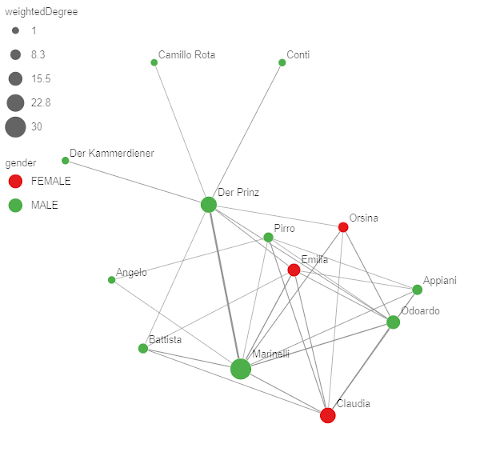
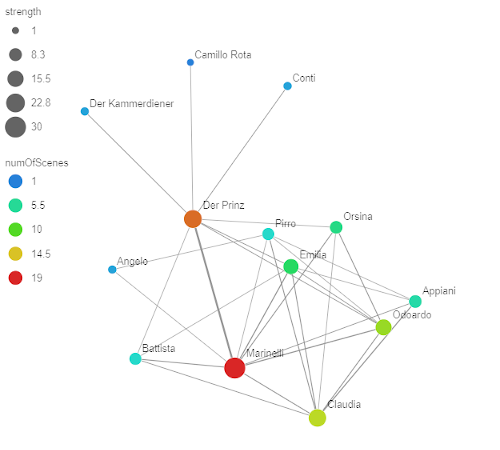
And now Lessing’s “Emilia Galotti” again:
# third network: gender groups with labels (size == weightedDegree)
# fourth network: numOfScenes groups with labels (size == strength)
As stated above, the HTML files generated by webweb embed all the JavaScript you need and you can save them as standalone pages: